THE PLATFORM
We only ship the tools we use.
Complex data, simplified
Complex data, read in a second. Everything here gets traded with in the room every session — nothing built to pad a feature list, nothing left up because it once looked good in a screenshot.
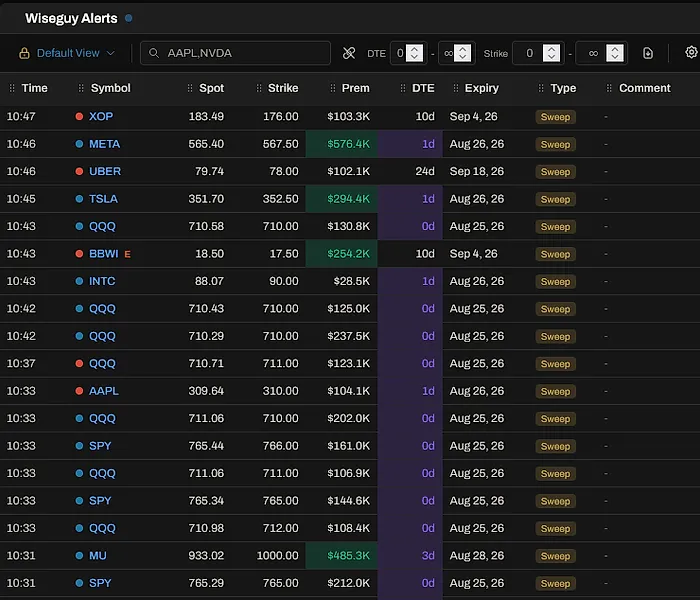
Wiseguy Alerts
Real money, printed live.
Over 50 million options contracts trade every session. Nobody filters that alone. We process all of it through filters built by Wall St. Jesus — a pioneer of options flow, 25 years reading it — and he adds his own picks on top. Not a raw scanner firing on everything that crosses the tape.
- Live sweeps as they print
- sub-second
- Curated by Wall St. Jesus
- filters + picks
- Custom tags and highlights
- yours to set
included with FZN PRO
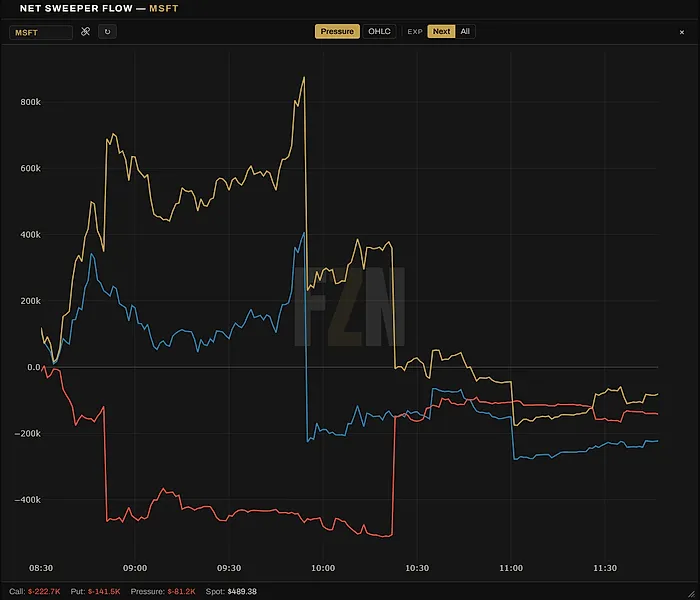
Net Sweeper Flow
Which side is paying up on any ticker.
Sweeps netted out across the session instead of read one print at a time. You see which side is actually paying up on a name, not just the last order that happened to cross.
- Net premium by side
- calls vs puts
- Next expiration or all expirations
- filter
- Live totals, updating every minute
- real time
included with FZN PRO
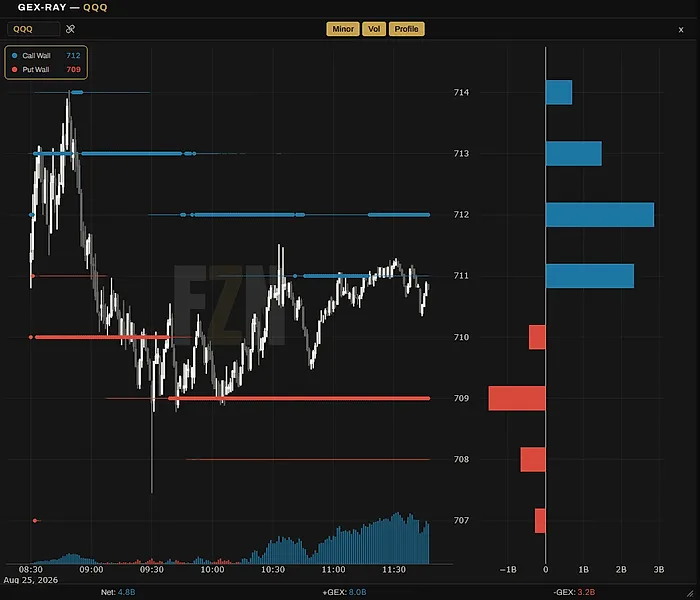
GEX-Ray
Live support and resistance, all session.
We pioneered this visualization. GEX-Ray reads where options are transacting through the day and maps it to potential support and resistance on the chart. It updates live, so the levels you're trading against are the ones the session is building, not yesterday's.
- Potential support and resistance
- mapped live
- Intraday naive gamma
- session only
- Levels redraw as the day moves
- market hours
included with FZN PRO
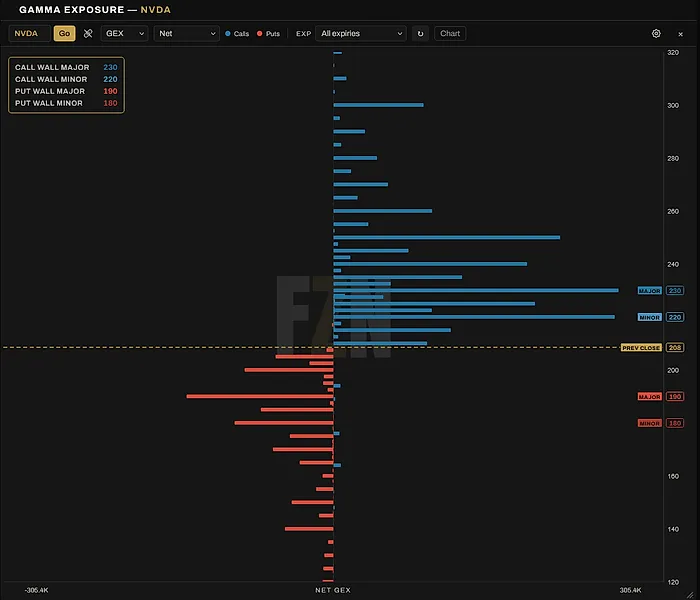
Gamma Exposure
See where options are concentrated.
Map end of day naive gamma exposure across every strike and expiry on the board. Quickly see where options activity is heaviest, which strikes stand out, and how that concentration is distributed across expirations.
- Call, put and net gamma
- naive
- Exposure by expiry
- stacked
- Largest strike concentrations
- major + minor
included with FZN PRO
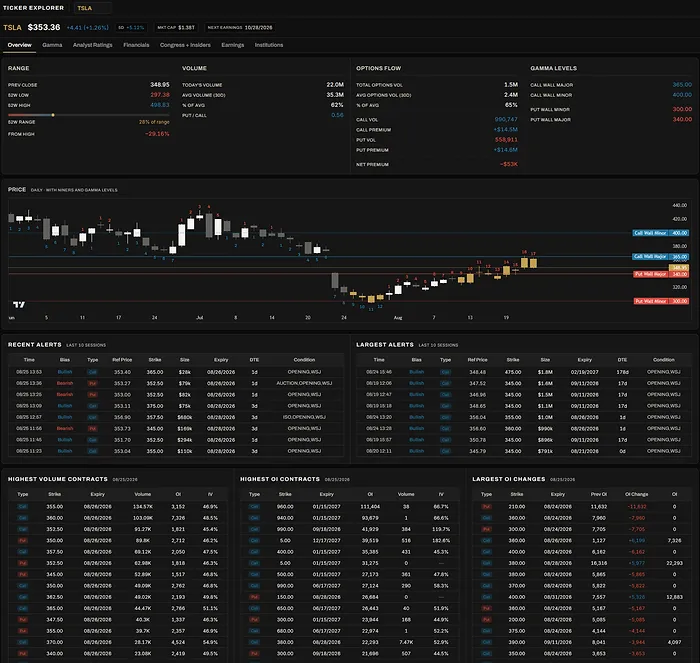
Ticker Explorer
One name. The full picture.
Everything that matters for a single name, in one place. Price, volume, options activity, key levels, ownership, earnings, and fundamentals, all organized so you can move from market action to company context without leaving the page.
- OI changes and highest volume contracts
- by strike
- Daily chart w/ niners + levels
- call + put walls
- Insiders and institutions
- who's holding
- Earnings, financials, ratings
- and more
included with FZN PRO
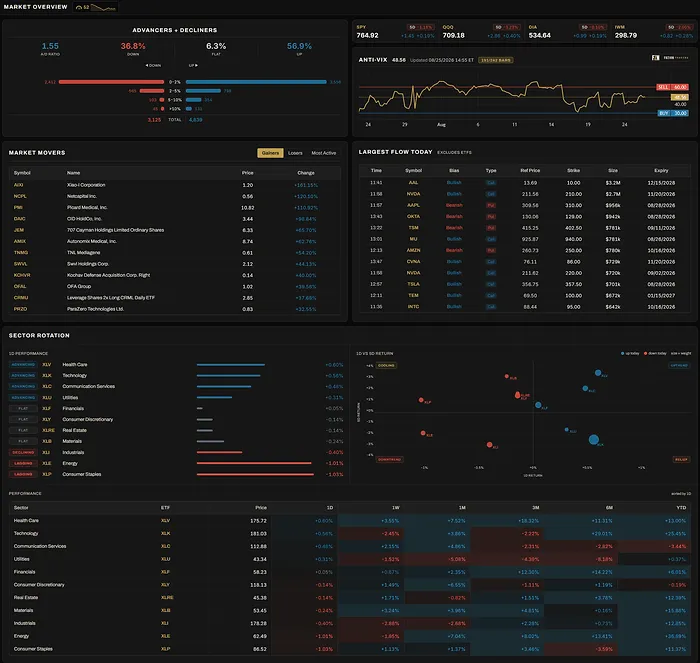
Market Overview
The whole market. One screen.
You could spend hours each day checking breadth, volatility, sector rotation, options activity, and analyst moves across a dozen different sources. Or you can see the market's most important signals in one place. Get your bearings fast, understand what's moving, and know where attention is shifting before you dig deeper.
- Breadth and market participation
- A/D ratio
- Anti-VIX reversion signal
- vol extremes
- Sector rotation, 1D vs 5D
- table + map
- Largest OI changes and analyst actions
- daily
included with FZN PRO